
2025 Mid-Year Market Breakdown: What SP/SF and Sales Volume Tell Us by Price Bracket
We’re halfway through 2025, and the Lehigh County housing market is still moving—but not in one direction. When it comes to real estate, buyers love to talk price. But smart appraisers (and savvy agents) know there’s a better metric for understanding value trends: price per square foot, or what we like to call the "package price." While sold price per square foot (SP/SF) keeps rising, sales volume is well below historic norms. And when you break the numbers down by price range, the story becomes even more telling. This update focuses on closed sales from January through June 2025 only, but the trends are clear enough to forecast the rest of the year with some confidence.
Robert G. Premecz, SRA
7/2/20253 min read
Sales Volume: Still Below Normal, Even After a Spring Bump
Sales slowed significantly in early 2025—down almost 30% compared to past years.
Spring brought some recovery (about a 42% increase from Q1 to Q2), but overall volume remains well below where we were in 2021 through 2023.
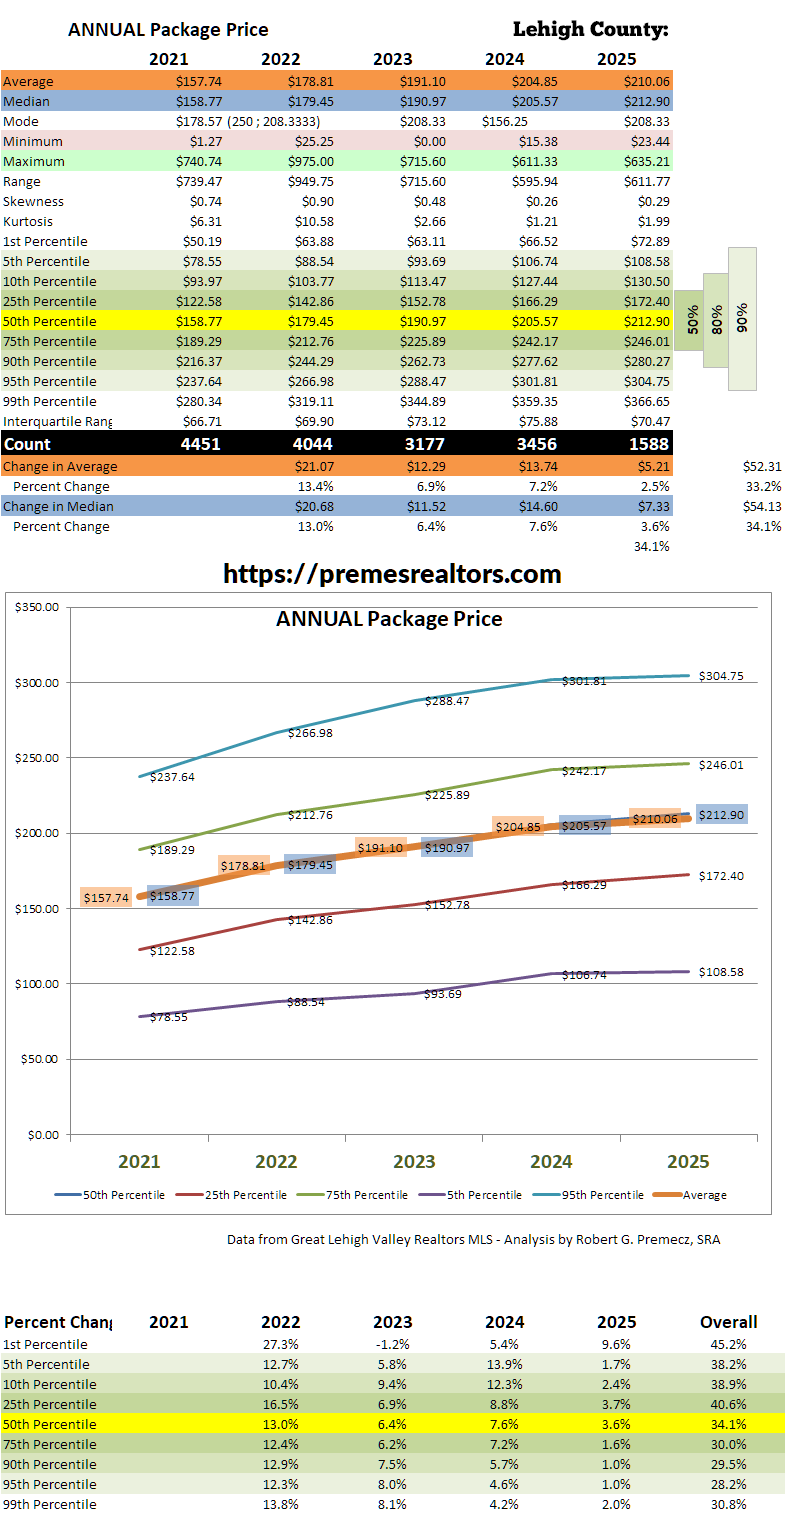
Annualized, we’re likely headed for a year with 3,100 to 3,200 total sales, compared to over 4,400 in 2021.
In short: fewer homes are being listed and sold, and that’s affecting different price tiers in different ways.
SP/SF by Price Bracket – January to June 2025
Let’s look at what buyers are paying per square foot in different price ranges:
🟢 Under $250,000
SP/SF: typically ranges from $140 to $185
These homes often have smaller footprints and fewer updates, but demand remains strong.
Appreciation is highest here—SP/SF is up 40–45% since 2021.
Sales volume is down, but competition remains stiff.
🔵 $250,000–$400,000
SP/SF: $190 to $230, depending on age, condition, and location.
This is the most active segment of the market in 2025.
Homes here are often move-in ready but not oversized—buyers are still paying a premium per foot.
🟡 $400,000–$600,000
SP/SF: $200 to $240, generally more stable.
This tier has seen modest appreciation, around 25–30% since 2021.
Fewer bidding wars, but well-priced homes still move.
🔴 $600,000+
SP/SF: often $180 to $220, depending on lot size, finishes, and design.
Prices have flattened, and in some cases SP/SF is below lower-priced homes, due to size and location differences.
Volume is thin; some homes are sitting longer.
What This Means
From an appraisal standpoint, here’s the real takeaway:
SP/SF is rising fastest in the lower brackets, which aligns with broader affordability pressures.
Higher-end homes aren’t appreciating as quickly, and their larger square footage is pulling SP/SF down.
Fewer sales overall mean fewer comps, especially in the outliers, so size, condition, and location comparisons matter more than ever.
The market is compressing—less inventory, tighter pricing, and narrower value spreads.
The Big Picture: Package Prices Keep Climbing
Average price per square foot (PP/SF) rose from $204.85 in 2024 to $210.06 so far in 2025.
Median PP/SF ticked up to $212.90, marking a 3.6% rise, and a 34.1% increase since 2021.
The mode (most common SP/SF) was $156.25—much lower than the average—suggesting many homes are priced well below the statistical middle and many buyers are still chasing affordability in narrower price bands.
Bottom line: While averages are rising, the typical sale still reflects budget-conscious choices.
From 2021 to Today: Smaller Homes, Higher Prices
A home with 1,500 square feet that sold for $236,000 in 2021 now sells for about $315,000—without adding a single square foot.
Entry-level buyers are paying more for less, and competition is fiercest in those segments.
Market Behavior: Cooled, Not Crashing (YET)
While price appreciation has slowed from its double-digit pace:
Average SP/SF grew 2.5% so far this year
Median grew 3.6%
But that's down from 7.6% in 2024, and 13.0% in 2021
We're not in free fall—we're in moderation mode.
A Final Thought from the Appraiser's Chair
Sold price per square foot is still going up across the board, but the rate of increase depends heavily on the price bracket. While average prices may suggest stability, SP/SF shows where the real appreciation is happening—and who’s feeling the shift the most.
Combine that with a sales volume drop of nearly 30% over four years, and the picture becomes clearer: demand hasn’t vanished—it’s just concentrated in the middle and lower tiers.
We’re not just seeing higher prices—we’re seeing more people fighting over the same square feet. In Lehigh County, that’s the real story behind the price per square foot.
As always, context matters. SP/SF by bracket, combined with volume trends, gives us one of the most balanced views of how the market is truly performing.